Having been asked what would a trader or macro manager do now on the Aussie Dollar position mentioned in a couple of articles (here and here) here is a response. Below in graphic one is the original set-up graphic annotated to show the current A$/US$ rate.
Graphic One - A$ v US$ over the six months to 9th March 2012

Sources: www.fxstreet.com, Hedge Fund Insight
Clearly the risk/reward has worked out well to date, but how much is enough?
There are two forms of feedback loop – the fundamental and the technical. If the fundamentals are still in gear with the original trade idea, and the outcomes are being driven for the reasons looked for then the trader will concentrate on the technical position.
As mentioned in the article on macro position taking of early last year the trader will have a series of measures or indicators he tracks once in a position – momentum measures, volatility measures, and flows to reflect the dynamics of market positioning. Although the fundamental rationale may still be in place with as much or more force than previously, any of these indicators alone or in combination may cause a macro trader to change his position size. The mindset is to win the war by winning the battles though not all the skirmishes.
In the case of the short Australian Dollar position (versus the US$) the battle plan is going fine (a positive P&L) but there may be a skirmish due to test the resolve of the bears on the A$. Markets don’t go up or down every day, and there are always intermediate reversals and consolidations, even in strong up or down trends or moves.
Just as there were significant market levels on the set-up, the A$ rate may have reached a zone of parity with the US$ which represents a test area for the technical side of the investment case. The zone is predicated on a combination of technical measures – previous highs or lows and natural reversals levels based on Fibonacci analysis. It is very common to look for zones of significance in price charts based on combinations of technical factors – Elliot wave analysis plus significant moving average levels, ichimoku levels plus medium term RSI, or Bollinger band support level and a medium term trend line. One measure in isolation is worth something, a combination of measures from different approaches is worth a lot more to the professional market watcher.
In the case of the A$ there are two nested Fibonacci levels and a previous interim top in the picture versus the US$. In the graphics below the Fibonacci levels are shown separately and then together.
Graphic Two - A$ v US$ over the last year showing set 1 of Fibonacci levels

Sources: www.fxstreet.com, Hedge Fund Insight
Graphic Three - A$ v US$ over the last year showing set 2 of Fibonacci levels and historically relevant price action
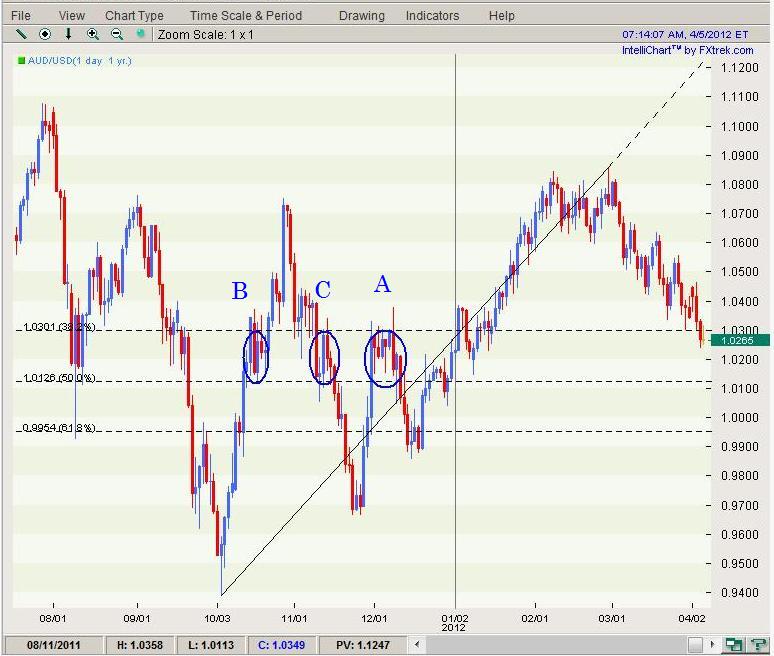
Sources: www.fxstreet.com, Hedge Fund Insight
In graphic three the price action circled and labelled A is much more significant than the zones circled and labelled B and C. The interim top at A in December 2011 might act as a support level for a declining A$. The circled areas B and C show that the A$/US$ rate spent slightly more time in this price band that at other levels nearby in recent market history.
Graphic Four - A$ v US$ over the last year showing sets 1 & 2 of Fibonacci levels

Sources: www.fxstreet.com, Hedge Fund Insight
In graphic four the 38.2% retracement level of one Fibonacci measurement is close to the 50% retracement level of the other Fibonacci measure.
The graphics illustrate that there is a chance that the A$ might try to find support around the current level. That is, if you like, a short term trading hypothesis. The medium term fundamental case is still in place, whether based on China’s impact on commodity prices or domestic Australian property prices.
A macro trader will now be in a twitchy mode of observing the market action where he has a position. There is as yet no market action in pure price terms (though there may be in RSI or flow information terms) to tell a (macro) trader to trim his position, but he will be watching intently for a trigger to cut his short A$ position by a third or a half. A trigger in the actual instrument traded could be any number of short-term patterns. A reversal day with good volume, a close near the high of the day or the markets acting to bad news for the A$ with stoicism (not going down) would all make a macro trader change his position.
It is very important for macro traders to observe consistency across markets and asset classes. The senior trader from Caxton illustrated that point in the article here last year. In that case how the S&P acted in concert with €/$ was watched closely. For the case in question, other commodity-related currencies and markets will be watched to see if they are reversing, even if the A$ does not do so on a given day. So the trigger to scale back the A$ position might come from another market (or more likely cluster of markets) that is expected to exhibit co-movements to the changes in A$/US$.
If the A$ does not show signs of reversal, some newly emergent strength, then the macro trader, whether at Bridegewater or Caxton Associates, will keep hold of the short position, until the pre-set take profit level comes in to view, or it becomes clear that the trade is getting crowded.


No comments:
Post a Comment